Try out different Equal Temperaments

Note: Code for this post is available on github here.

Tuning scales is about ratios. We multiply the root frequency by a given ratio to get a note in the scale. In Equal Temperament, all ratios are equal, the 12th root of 2. Which is 21⁄12. We multiply a frequency by that to get the next frequency in the scale. When we’ve gone through all 12, we get the octave. (21⁄12)12 = 2.

Let’s say we want the 3rd note in the chromatic scale. We have the root and multiply by the ratio for the second and then for the third. For the fourth, we do it three times. For the fifth, four times. Therefore, for any chromatic scale step 𝘯, we multiply the root by 2(𝘯-1)⁄12

But, especially when we’re using computers, we can try out putting the notes in different places! What if we have 10 steps per octave? Then our ratio is Which is 21⁄10. The composer William Sethares has written music using 10 tone equal temperament and in other unusual tunings, which you can listen to on his web page.

We can even forego octaves entirely. The Bohlen-Pierce scale is based on divisions of 3, rather than 2. When people use equal temperament with that scale, they typically have 13 steps in the octave, which makes their ratio 31⁄13. The composer Elaine Walker is one of many who has written music using Bolhen Pierce and you can find examples on her website.

We can also try out different tunings ourselves! Below, you can try out different Equally Tempered scales. Change the steps value for the number of divisions you want. If you want to try out Bohlen-Pierce, change the octave ratio to 3. Or try whatever tickles your fancy.


Your tuning ratio is 21⁄12, which is equal to 1.0594630943592953

12tet’s ratio of 21⁄12 is equal to 1.0594630943592953

It can sometimes be difficult to hear the differences in pitches just going up and down a chromatic scale. Modes like major and minor are very strongly tied to a 12 note chromatic scale and it doesn't make sense to try to, say, play a 10 note major scale. However, the octatonic scale is a mode that can potentially work for any tuning. It alternates whole and half steps. Perhaps listening to the octatonic versions of your scale and 12tet will demonstrate the differences more clearly.


Or we can try a phrase by Debussy:


Science of Sound Week 2

Frequency

Previously, we talked about wave length and frequency. We measure frequency in Herz, abbreviated as Hz. A 1Hz sine wave goes through a complete cycle one time per second. A 440Hz sound wave goes through a complete cycle 440 times per second. The frequency is the reciprocal of the duration. A single cycle of a 440 Hz sine wave is  \frac {1} {440}th of a second.

We also talked about the speed of sound, which is 340 m/s at 20 degrees celsius. If we have a 1 Hz wave, travelling at 340m/s, it takes one full second to get through the complete cycle. Which means that the front of the sound wave is 340 metres away from the back. The wavelength is 340 metres.

A 2 Hz sine wave also travels 340m/s. The time it takes to get through each cycle is half a second. In half a second, the front has travelled 170 metres, which is to say that’s the wave length.

A 10 Hz sine wave lasts \frac{1}{10}th of a second, so the wave length is \frac{340}{10}, which is to say 34 metres.

A 100 Hz sine wave is \frac{340}{100} = 3.4 metres. The octave higher, 200 Hz, is 1.7 metres. The wave length is the speed of sound (c in the formula) divided by the frequency. \lambda = \frac{c}{f}

Tuning

We mentioned 440 Hz in the first paragraph. If that sounds familiar, it’s because it’s also the frequency of most tuning forks. It’s the defined frequency for A.

MusicSheetViewerPlugin 4.1

We also know that if we double the frequency to 880, that’s also and A. Or if we halve it to 220.

MusicSheetViewerPlugin 4.1

110 Hz, 55 Hz and 27.5 Hz are also As. As we get lower the frequencies get closer together and as we get higher they’re farther apart. 7040 Hz and 14080 Hz are also As.

We know that all As are 440 multiplied or divided by a power of 2. We also know that doubling any frequency gives us an octave of that frequency. We can generalise from this to come up with a formula for a one note scale based on the octave. Where f is frequency, f \times x = 2f. It’s obvious here that x is 2.

What if we want a two note scale that uses Equal Temperament? This is a system where all the notes are equally distant from each other perceptually. We know that this has to be based on multiplication. We want an equal ratio between all the notes. Therefore to get from the bottom note to the next one, we need to multiply by some number x. And then to get from the middle note to the octave, we multiply by x again. f \times x \times x = 2f We can simplify those two xs.  \therefore f \times x^2 = 2f And divide both sides by f.  \therefore x^2 = 2 Solving for x:  \therefore x = \sqrt{2}. Our two note scale is 440, 622.25, 880. This is because  440 \times \sqrt{2} = 622.25 and  622.25 \times \sqrt{2} = 880

What about a three note scale? f \times x \times x \times x = 2f Which means  \therefore x^3 = 2 and so  \therefore x = \sqrt[3]{2} To work out this scale,  440 \times \sqrt[3]{2} = 554.37,  554.37 \times \sqrt[3]{2} = 698.46, and 698.46 \times \sqrt[3]{2} = 880.

If we want a 4 note scale, we can use \sqrt[4]{2} or for a five note scale \sqrt[5]{2}. But for a piano, we want 12 notes, including all the white and black keys.

Therefore, the tuning used by the piano, called “12 Tone Equal Temperament” (or 12tet) uses \sqrt[12]{2}.

We know that the frequencies are exponential, but perceptually, the difference between a C and and A is the same in any octave. Our scales and keyboards and the musical concept of pitch is linear. Every octave may double in frequency, but it’s always only 12 semitones.

Figure 5: “Logarithmic plot of frequency in hertz versus pitch of a chromatic scale starting on middle C.” via https://en.wikipedia.org/wiki/Musical_note. Image by Jono4174, public domain via Wikimedia Commons.

You now know enough to work out the frequency for every single note on the piano. (Or, you can look it up on wikipedia.) You can also work out the wavelength for every frequency on the keyboard. If the lowest note is A0, the frequency is 27.5 Hz, so the wavelength \lambda = \frac {340}{27.5} = 12.4 metres. And the highest note, C8 is 4186 Hz, so \lambda = \frac {340}{4186} = 0.081 metres. What a range! And that’s not even the highest note we can hear!

Going Further

Not all scales are based on octaves! The Bohlen-Pierce scale is based on multiplying frequencies by 3. How could you compute an equally tempered scale for Bohlen Pierce? If you wanted the scale steps to be roughly the same size as 12tet, how many scale steps would you use?

Waves

What if we want to graph the pressure changes in air made by somebody playing the flute? The graph might look a bit like this:

The vertical axis is pressure and the horizontal axis is time. We can see the pressure increase, decease and increase again. The idealised wave form shown here is a sine wave. This wave has exactly one frequency in it and is the simplest possible wave form.

If you generate a sine wave in your DAW and then zoom way in, you’ll see exactly the same shape, but in that case, the Y axis is how much the speaker cone will offset when we play back the sound. This makes sense. The speaker needs to push the air to make the sound wave. If we were looking at an analogue signal to the speaker via an oscilloscope, the Y axis would be the amount of voltage.

If the wave is taller, the speaker moves more air and the sound is louder. The height of the wave is the amplitude.

The distance from one peak to another, Îť, is the wavelength. If the wavelength is shorter, the speaker cone moves faster. A faster movement and a shorter wavelength means a higher frequency.

We’ve measured from the peaks, but we could measure from any point along the curve, for instance, from the zero crossings, as long as the wave has been through a complete cycle.

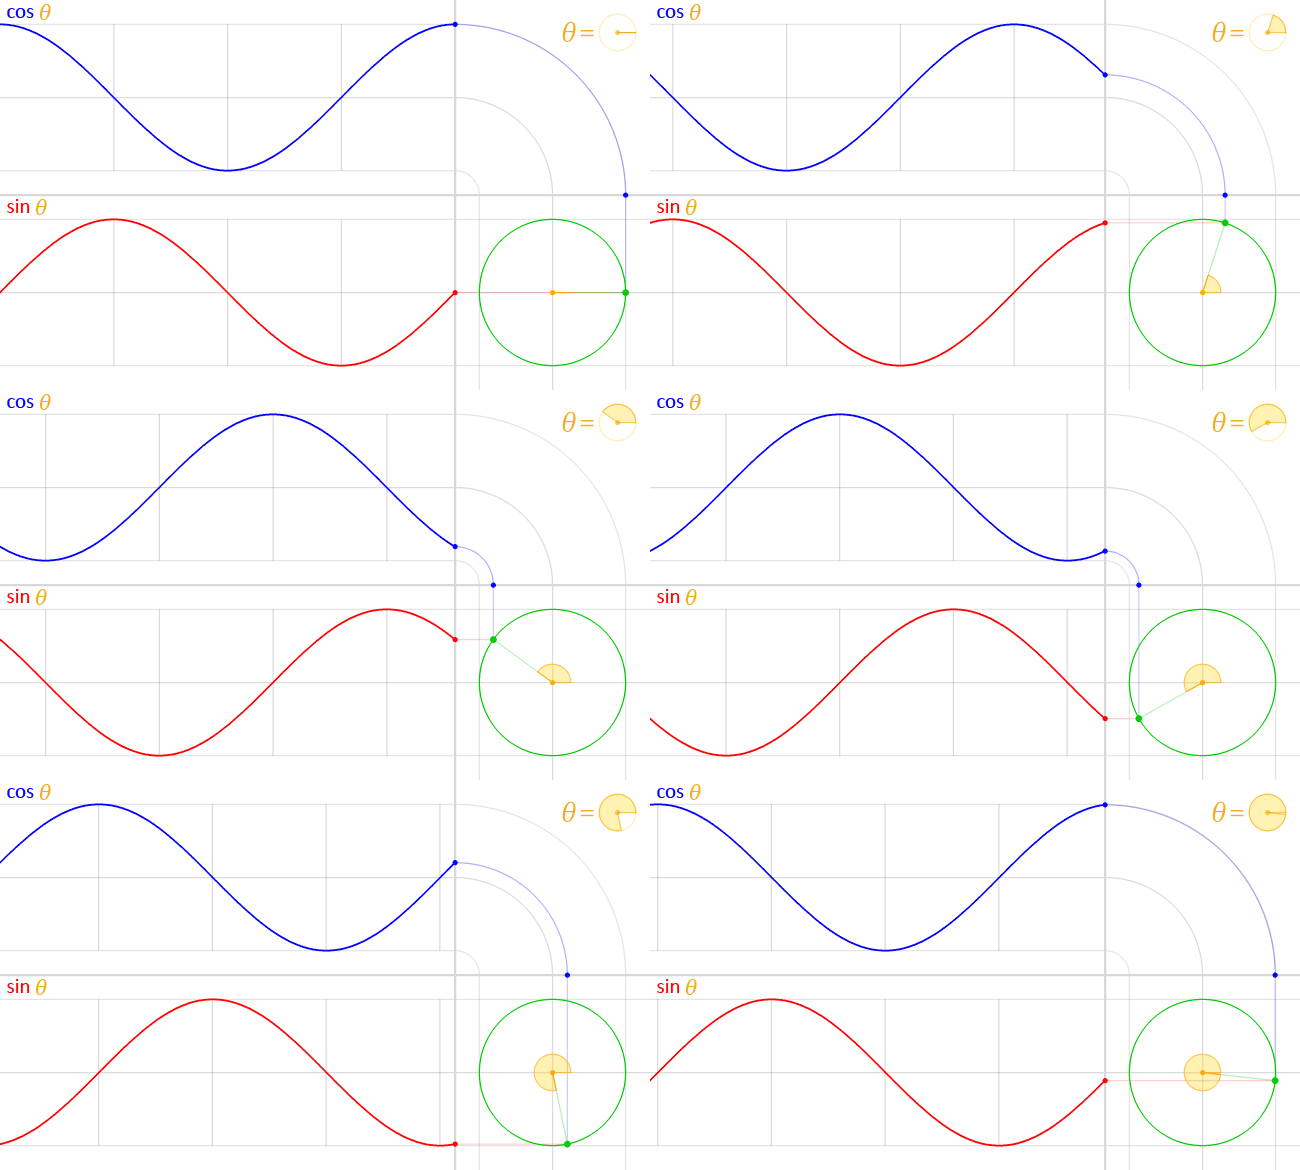
If waves start at different points but have the same wavelength, we say they are the same frequency but have different phases. In figure 3, the red line starts at zero and is a sine wave. The blue line starts at 1 and is a cosine wave. They both are the same frequency.

We have the unit circle (with radius = 1) in green, placed at the origin at the bottom right.

In the middle of this circle, in yellow, is represented the angle theta (θ). This angle is the amount of counter-clockwise rotation around the circle starting from the right, on the x-axis, as illustrated. An exact copy of this little angle is shown at the top right, as a visual illustration of the definition of θ.

At this angle, and starting at the origin, a (faint) green line is traced outwards, radially. This line intersects the unit circle at a single point, which is the green point spinning around at a constant rate as the angle θ changes, also at a constant rate.

The vertical position of this point is projected straight (along the faint red line) onto the graph on the left of the circle. This results in the red point. The y-coordinate of this red point (the same as the y-coordinate of the green point) is the value of the sine function evaluated at the angle θ, that is:

    y coordinate of green point = sin θ

As the angle θ changes, the red point moves up and down, tracing the red graph. This is the graph for the sine function. The faint vertical lines seen passing to the left are marking every quadrant along the circle, that is, at every angle of 90° or π/2 radians. Notice how the sine curve goes from 1, to zero, to -1, then back to zero, at exactly these lines. This is reflecting the fact sin(0) = 0, sin(π/2) =1, sin(π) = 0 and sin(3π/ 2) -1

A similar process is done with the x-coordinate of the green point. However, since the x-coordinate is tilted from the usual convention to plot graphs (where y = f(x), with y vertical and x horizontal), an “untilt” operation was performed in order to repeat the process again in the same orientation, instead of vertically. This was represented by a “bend”, seen on the top right.

Again, the green point is projected upwards (along the faint blue line) and this “bent” projection ends up in the top graph’s rightmost edge, at the blue point. The y-coordinate of this blue point (which, due to the “bend” in the projection, is the same as the x-coordinate of the green point) is the value of the cosine function evaluated at the angle θ, that is:

    x coordinate of green point = cos θ

The blue curve traced by this point, as it moves up and down with changing θ, is the the graph of the cosine function. Notice again how it behaves at it crosses every quadrant, reflecting the fact cos(0) = 1, cos(π/2) = 0, cos(π) = -1 and cos(3π/2) = 0.
Figure 4: Sine and Cosine wave by Lucas Vieira, Public domain, via Wikimedia Commons

In figure 4, we can see an animation of the cosine and sine wave moving at the same frequency and how they are related to each other.

Summary

In the last three posts, we learned that sound is made up of tiny pressure waves which travel at 340 m/s. When these strike our ear drums, this in turn causes our basilar membrane to vibrate. Distinct vibrations on the membrane are heard as distinct frequencies.

We can graph the pressure waves of the sound. This is the same as the waveform graph in our DAW and is the same as the change in voltage of the signal going to our speakers. All signals going to our speakers have an amplitude, where taller is louder. Periodic sounds, like sine waves, also have a frequency, where a shorter wave length is a faster vibration and a higher pitch.

Waves can have the same frequency but be out of phase with each other, so their peaks and troughs do not line up.

Supplementary Reading

Everest, F.A. and Pohlmann, K.C. (2015). Master Handbook of Acoustics. Sixth edition. New York: McGraw-Hill Education. – Chapter 1

Activity

Materials

  • Audacity
  • Sonic Visualiser
  • A Microphone
  • An audio interface (or other way to get microphone input into your computer.)
  • A quiet corridor with a wall some meters distant
  • A tape measure
  • Optional: a room thermometer

Method

Place your microphone so it points at the wall. Start recording into Audacity. Stand behind the microphone. Clap. Stop recording.

Check your recording. You should have two impulses on the recording. One is the loud clap and the second is the echo of the clap. If these are too close together, move further from the wall.

Once you have a clean recording, export it as a WAV file and open it in Sonic Visualiser. Use the tape measure to measure how far you are from the wall.

Listen for when the first echo appears, and see if you can measure the distance in milliseconds using the display.

You might need to experiment a bit with the zoom controls, and possible other controls in Sonic Visualiser to make it clearer to see where the echo appears.

Also, it won’t necessarily be an exact point, so you may have to use your judgement.

Remember that the sound has to travel to the wall and back, so the total distance is double what you measured.

What was the speed of the sound. Is it what you expected? If you were able to measure the temperature, how much impact did that have on the speed?

Your Ear / Your Hearing

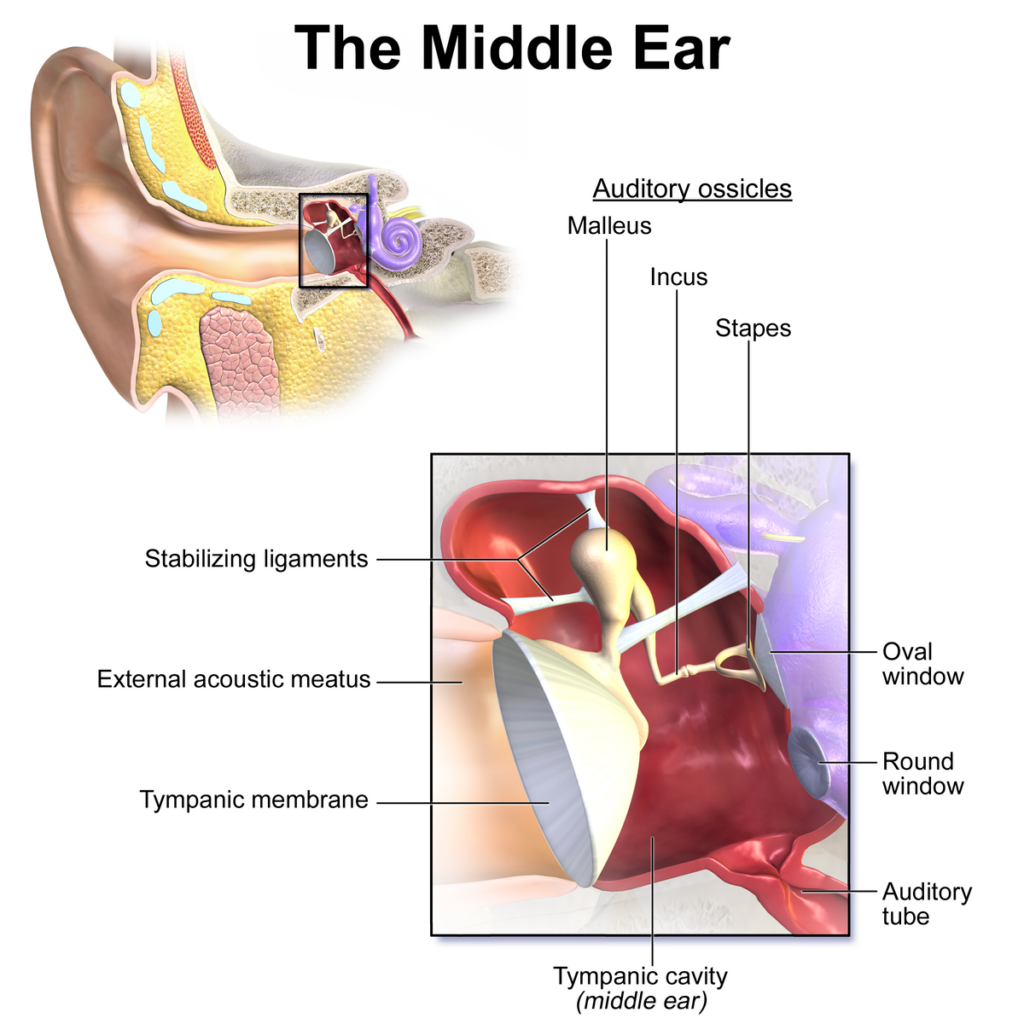
What’s happening in your ear? The outer ear, the pinna, helps you collect sound and holds your piercings, but the more interesting stuff, from a hearing perspective, is down the canal.

Sound waves hit our tympanic membrane, which is to say, our ear drum. Three tiny bones, the smallest in our bodies, the malleus, the incus and the stapes, transmit the movements of the ear drum to an oval window. The oval window is attached to the inner ear, which is a rigid structure. The stapes pushes on the window, moving fluid inside the inner ear. Below the oval window is a round window. As the oval window is pushed in, the round window bulges out. This allows the fluid to move, as liquids are much less compressible than air.

This whole structure of the ear drum, the little bones and the window, take a movement in air and turn it into a movement in liquid.

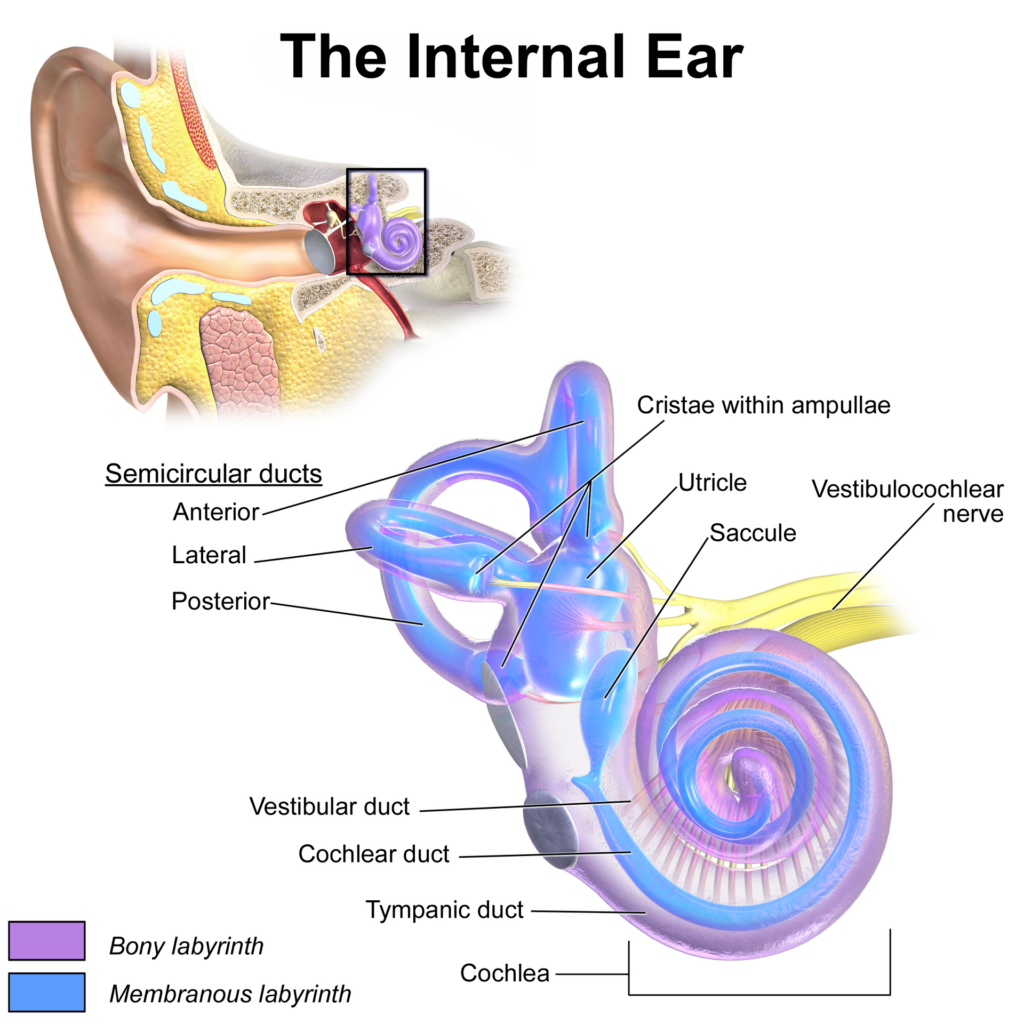
This liquid moves inside the cochlea, a snail shaped part of our ear. Inside that is the basilar membrane. This part of your ear is covered with tiny cells, called hair cells that wiggle in response to sound. The part of the membrane closest to the oval window responds to high frequency sounds, where the part furthest away responds to low frequency sounds.

When you hear a high frequency sound, the hair cells close to the oval window wiggle and send nerve signals to your brain. When you hear a low frequency sound, the hair cells further from the window are wiggling. These hair cells are fragile and can break in response to loud sounds. When they do break, they do not grow back. If you listen to ear buds too loudly, you can break these cells and your hearing will not come back. The hair cells closest to the ear drum are high frequencies and people tend to loose high frequency hearing first. When babies are born, their hearing is so sensitive that the lower threshold is just above individual air molecules hitting the tympanic membrane. People’s hearing gets worse from environmental factors including infections and exposure to loud sounds, but not from age. Wear protection to loud concerts and turn down your headphones to preserve your hearing.

When you are listening to two different frequencies, two different parts of your basilar membrane will wiggle. If those frequencies are far apart, you can hear each one individually. However, if the frequencies are close together, the parts of the basilar membrane that are wiggling can start to overlap. In this case, sometimes one sound can mask another, so we can’t hear both.

Image Sources:

Medical gallery of Blausen Medical 2014 (2014). WikiJournal of Medicine [Online] 1. Available at: https://en.wikiversity.org/wiki/WikiJournal_of_Medicine/Medical_gallery_of_Blausen_Medical_2014 [Accessed: 10 April 2024].

Further reading / watching:

Auditory Transduction (2002) (2009). [Online]. 6:43. Available at: https://www.youtube.com/watch?v=PeTriGTENoc [Accessed: 10 April 2024].

The Science of Sound

I’m not teaching any more, but I don’t want to just bin a decade worth’s of lecture notes, so here’s part of the first lecture tech students get in their first week of university:

To talk about sound, we must first talk about air. This is made up of about 78% nitrogen, 21% oxygen and various other gases. At 20 degrees Celsius (that is, room temperature), each air molecule is moving all the time at 500 metres per second. They are constantly colliding with each other and with anything in their path.

If a football hit you at 500 m/s, you’d be in trouble, but air molecules are tiny. Force = mass* acceleration. The force of a football is huge in comparison to a single nitrogen atom. But if you pump a lot of air into a tyre, say 6 bar (87 psi), the force of all the colliding air molecules will make the tyre very stiff. At sea level, the pressure of the atmosphere is about 1.03 bars (14.7 psi).

So how does sound propagate in air? Let’s say Adam Kryński hits his Bodhrán with a stick.

This causes the drum membrane to move very suddenly. He pushes the membrane and, on the other side of the drum, the membrane pushes on all the air molecules. They get packed in together. This creates a band of high pressure, that starts at the drum and moves outwards. All the molecules are moving at 500 m/s. But they’re not all going in the same direction. Some are going away from the drum, but some are going sideways or backwards. They’re all crowded though, and colliding into the molecules around them, so that wave of intense collisions, the high pressure wave, is moving away from the drum at 340 m/s, at room temperature.

If we were in Death Valley when it was 20 degrees out, the air pressure would be higher, so there would be more collisions. However, the air molecules would still be moving at their normal speed, so the pressure wave would still move at 340 m/s. If we were on Mount Everest at 20 degrees, there would be fewer collisions, but the speed would still be the same.

However, at 30 degrees, air moves faster, so sound moves faster. And at 10 degrees, air is slower so sound is slower.

Kryński’s drum head has creates a high pressure wave when it moved from being hit, but it doesn’t stay in that position. The drum head snaps back in the other direction, passing it’s mid point. This movement backwards creates a space where there are fewer air molecules. A low pressure wave follows the high one, moving at the same speed.

The head, still out of place snaps back forwards again, creating another, smaller, pressure wave and then another smaller wave of low pressure.

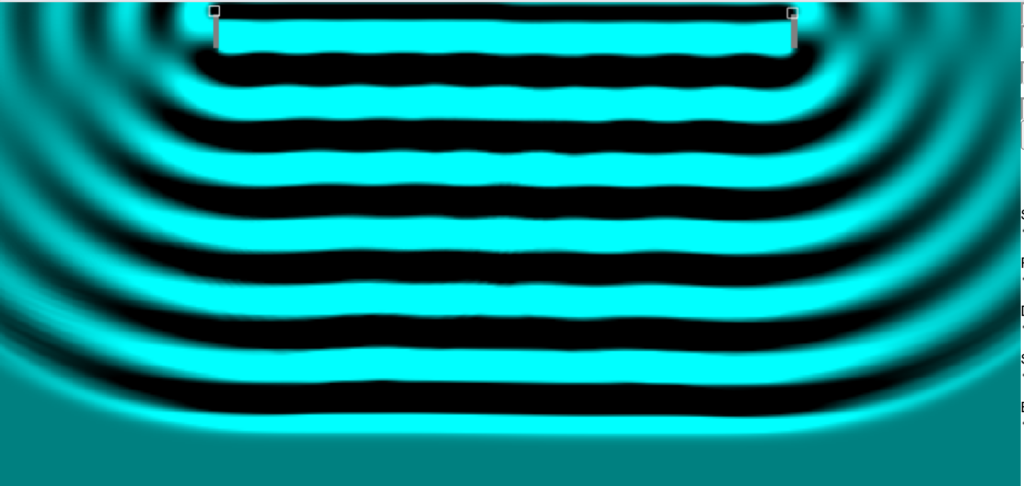
We can see a simulation of this drum head via Falstad.

Alternating light and dark lines fan out from the top of the image towards the bottom.
Figure 2: A ripple tank simulation of a vibrating plane with a short wall on either side, generated via Falstad

You can see the high and low pressure waves. In this simulation, the drum head vibrates forever, but it does give you an idea of the sound waves moving away from the drum.

These sound waves might reach your ear. But what is the amount of pressure change that your ear is actually perceiving? At sea level, the pressure of the atmosphere is 101.3 kilo pascals. The pressure change created by sound waves is in micro pascals, a tiny amount. It’s possible for air pressure to vary by more than that. A 1% change in pressure travelling at the speed of sound is, essentially, an explosion that can knock over a building. Atmospheric pressure, such as high and low pressure fronts you hear about in the weather forecast, has big variances relative to sound, but these changes happen very slowly.