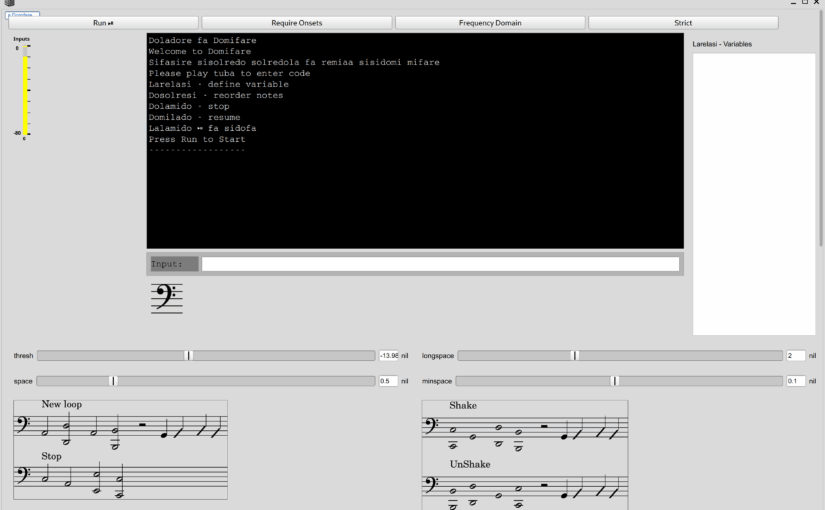
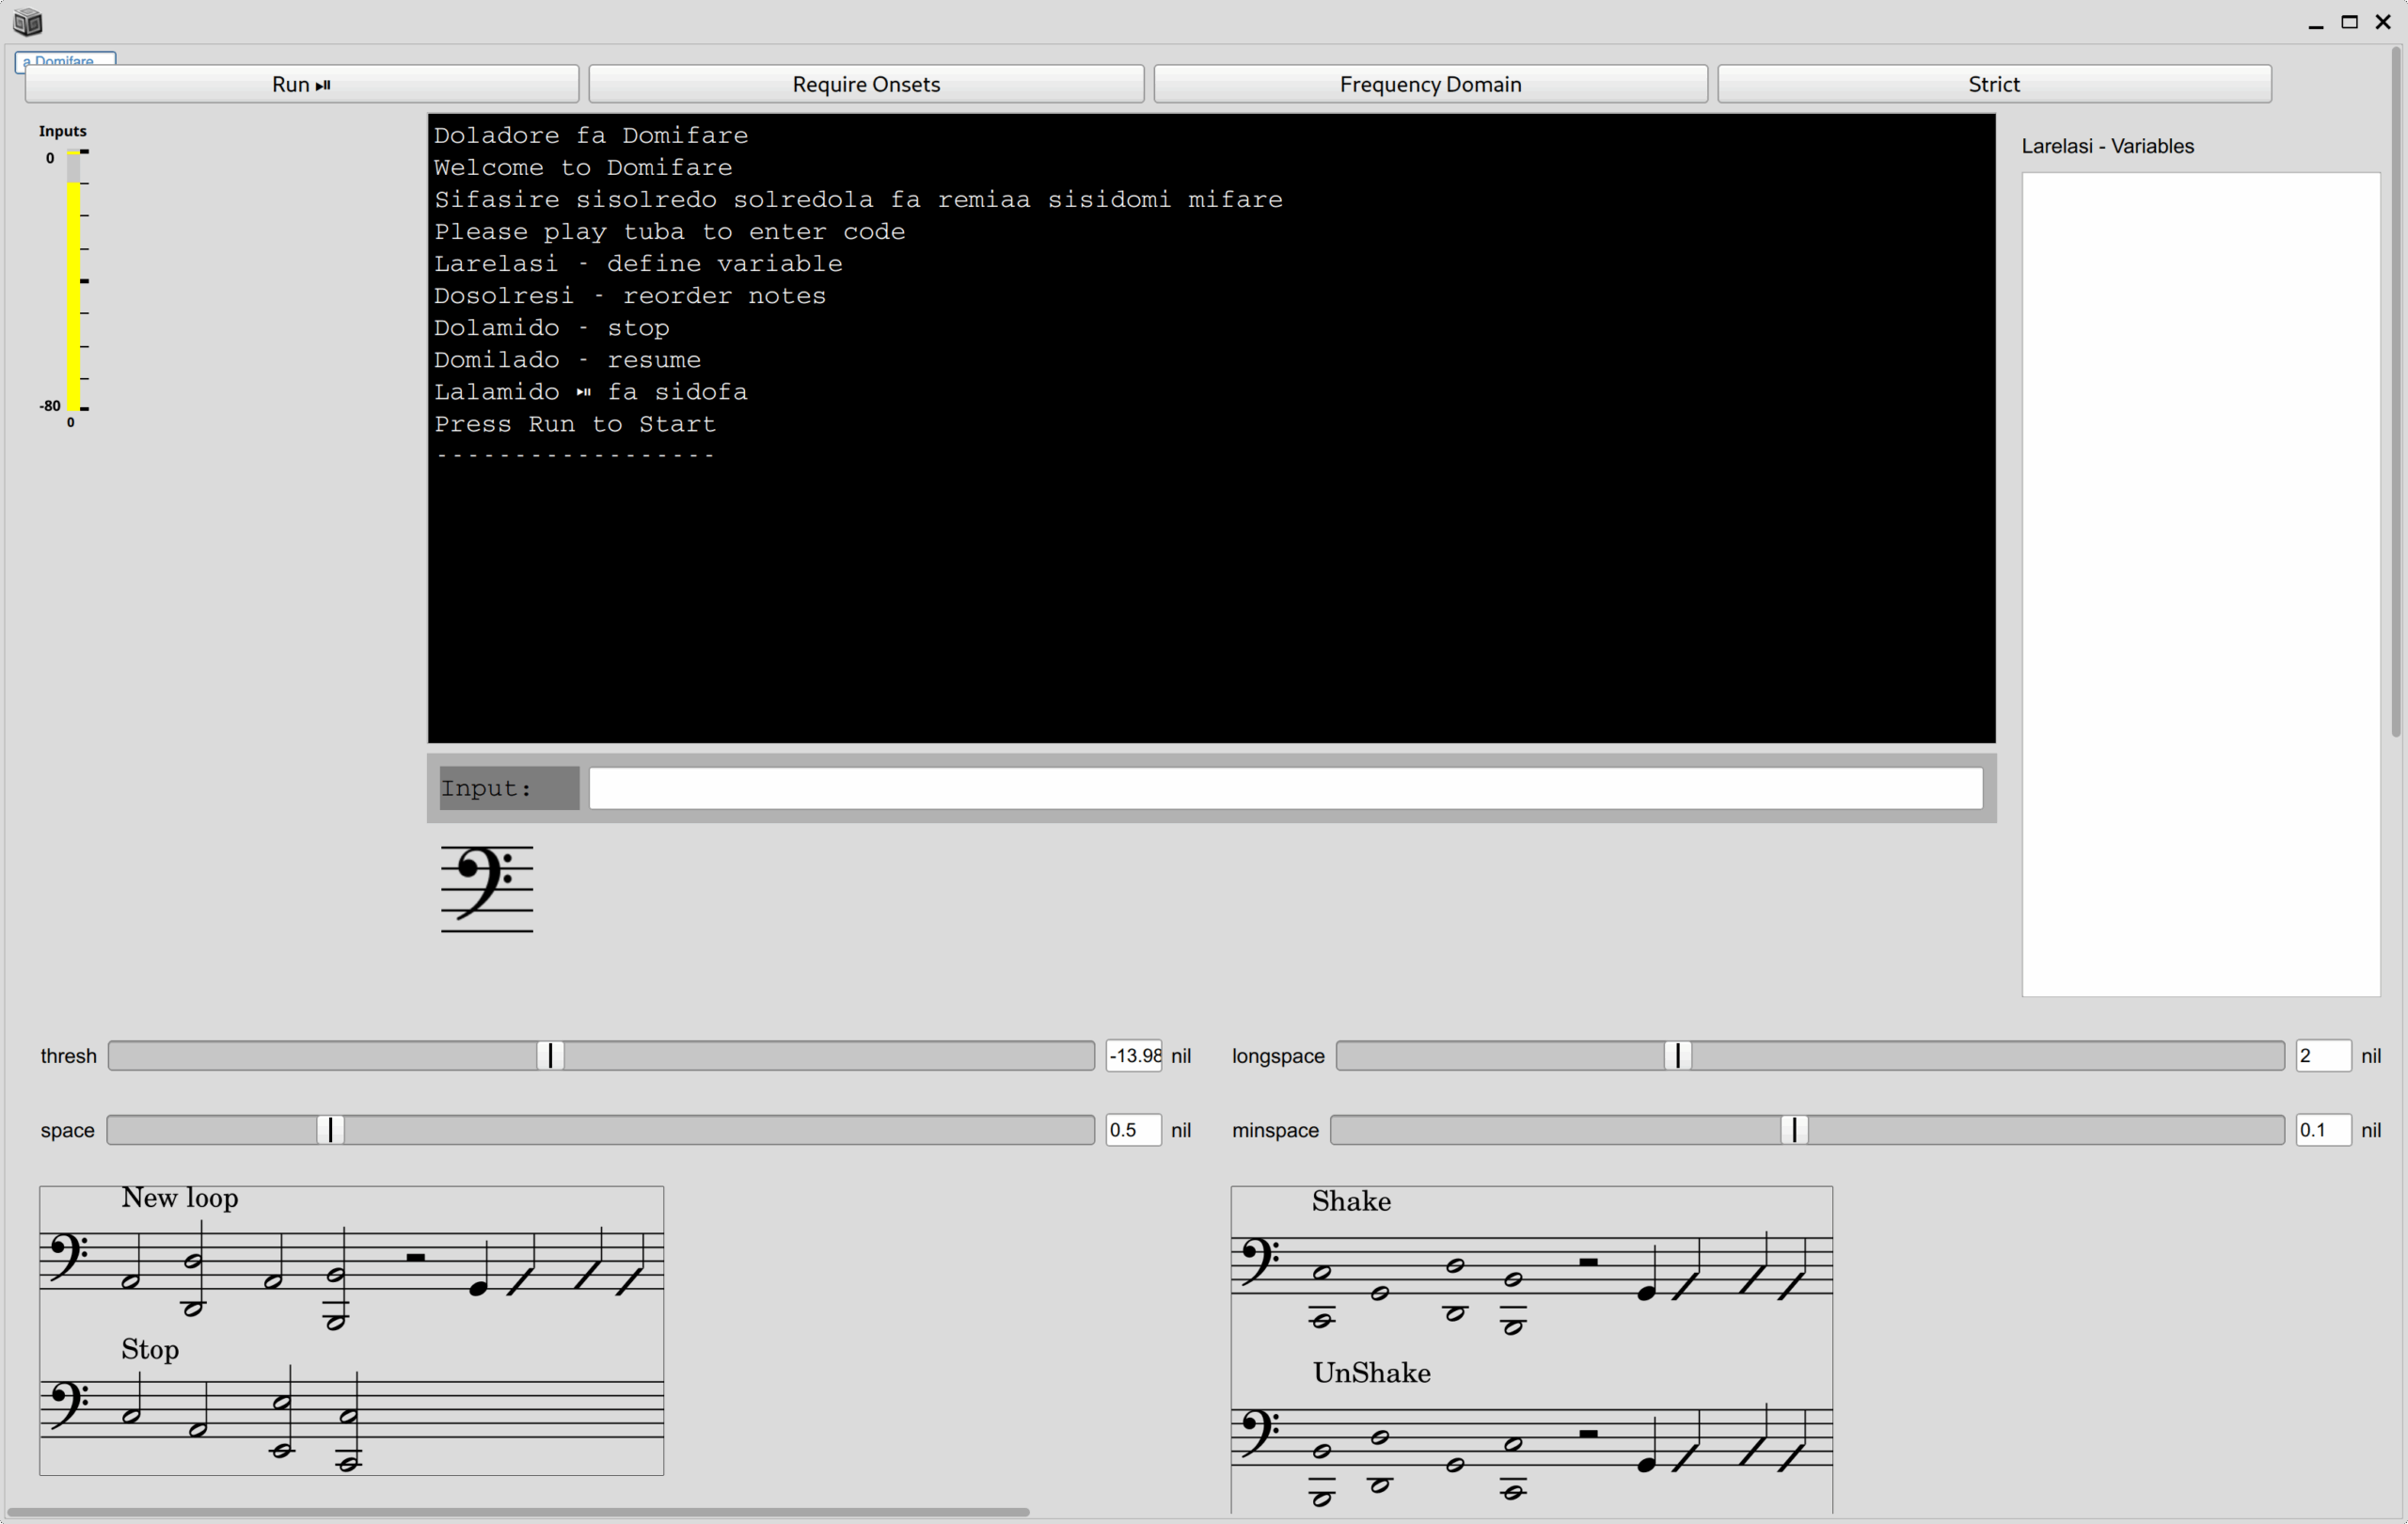
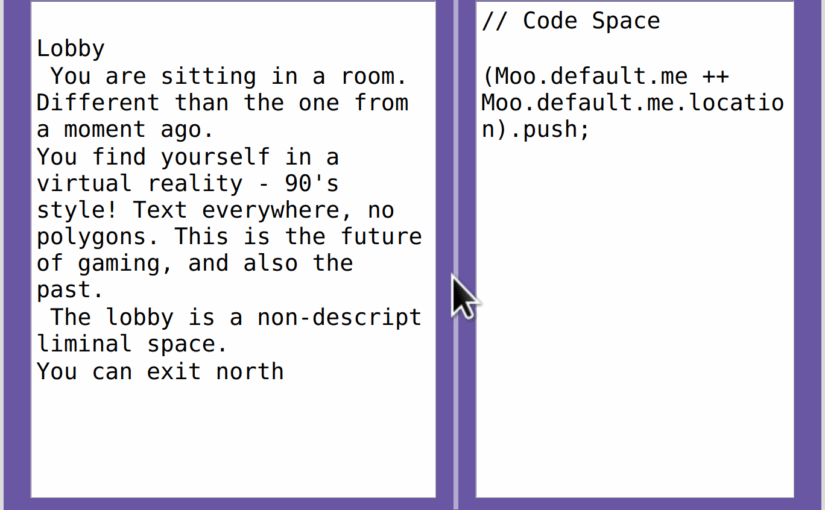
Friends, I wrote a Moo in SuperCollider.
Well, it’s partially written. Anyway, the point is that you can log in and play with the database developed by Shelly Knotts.
A proper tutorial will be coming, but between this, the included help files and the Github Readme should be enough to get started. If you experience any problems with this script, please leave a comment or reply.
Before you run it the first time, you must install two Quarks.
Quarks.install("https://github.com/celesteh/BiLETools.git");
Quarks.install("https://github.com/celesteh/SCMoo.git");
This should cause the required Quark, JSONlib, to automatically install.
Then you will need to run all of the following code, which you may wish to save in an scd file. Please edit it so variable a gets your name.
(
a = "MyName";
g = "Moo".toUpper;

w = MooWebSocketResponder(a,"UserPassword",g,"GroupPassword", "https://moo.blessing.exchange/osc.html").echo_(true);

s.waitForBoot({

	//trapdoor

	SynthDef(\trapdoorCrash, {|out, amp=02, gate=1, pan=0, dur=1|

		var env, noise, chaos, panner, sin, senv, sline, sfreq;

		chaos = EnvGen.kr(Env.perc) * 2;
		noise = Crackle.ar(chaos, amp);
		senv =  EnvGen.kr(Env.perc) * 200;
		sfreq = Rand(60, 80);
		sline = XLine.kr(sfreq, 50, 1);
		sin = SinOsc.ar(sline + senv) / 2;
		env = EnvGen.kr(Env.perc, doneAction:2);
		panner = Pan2.ar(noise + sin, pan, env);
		Out.ar(out, panner);
	}).add;


	// 7 midi
	SynthDef(\trapdoorSines, {|midinote, amp, dur, gate=1, out|
		var sines, env, filter;

		env = EnvGen.kr(Env.asr, gate, doneAction:2);
		sines = Splay.ar(
			[0.5, 1, 2, 4].collect({|i|
				[
					SinOsc.ar(((midinote - 7).midicps *i), 0, amp),
					SinOsc.ar(((midinote).midicps *i), 0, amp),
					SinOsc.ar(((midinote + 7).midicps *i), 0, amp)
				]
		}).flat, 1, env);
		filter = BBandPass.ar(sines, 500);
		Out.ar(out, filter);
	}).add;

	SynthDef(\trapdoorOpen, {|out, amp=02, gate=1, dur=1|
		var pos, saw, env, freq, panner;

		pos = SinOsc.ar(2/dur);
		freq = (pos * 150) + 150;
		saw = Saw.ar(freq, amp);
		env = EnvGen.kr(Env.asr, gate, doneAction:2);
		panner = Pan2.ar(saw, pos, env);

		Out.ar(out, panner);
	}).add;

	SynthDef(\trapdoorSplash, {|out, amp=02, gate=1, dur=1, pan=0|

		var noise, panner, env, fenv, filter;

		noise = WhiteNoise.ar(amp*2);
		fenv = (EnvGen.kr(Env.perc(releaseTime:dur)) * 400) + XLine.kr(800, 200, dur);
		filter = RLPF.ar(noise, fenv);
		env = EnvGen.kr(Env.adsr, gate, doneAction:2);
		panner = Pan2.ar(filter, pan, env);

		Out.ar(out, panner);
	}).add;


	// bats

	SynthDef(\batAttack, {|freq, amp, dur, gate=1, pan, out|

		var sin, panner, env, pmenv, pm;

		pmenv = (EnvGen.kr(Env.adsr) * pi) + (pi/3);
		pm= SinOsc.ar(freq * (37/41), 0, pmenv);
		sin = SinOsc.ar(freq, pm, amp);
		env = EnvGen.kr(Env.adsr, gate, doneAction:2);
		panner = Pan2.ar(sin, pan, env);
		Out.ar(out, panner);
	}).add;

	SynthDef(\batSing, {|freq, amp, dur, gate=1, pan, out|

		var trig, vosim, panner, filter, env;

		trig = Impulse.ar(freq/2, 0.1, EnvGen.kr(Env.asr, gate));
		vosim = VOSIM.ar(trig, freq*3);
		filter = BPF.ar(vosim, freq*2);
		env = EnvGen.kr(Env.triangle(dur), doneAction:2);
		panner = Pan2.ar(filter, pan, env);
		Out.ar(out, panner)
	}).add;

	SynthDef(\batPing, {|freq, amp, dur, gate=1, pan, out|

		var sin, env, panner;

		sin = SinOsc.ar(freq, 0, amp*2);
		env = EnvGen.kr(Env.perc, doneAction:2);
		panner = Pan2.ar(sin, pan, env);
		Out.ar(out, panner);
	}).add;

	SynthDef(\bass, { |out=0,amp=0.1,sustain=0.2,freq=200,fb=0, room=3, mix=0.5, res=0, nois=0.2, trem_freq=4, depth=0.9, rel=0.1, att=0.01, frange=50, del=0.05, comb=0.2, freq_n=3, width=1.0, dec=0.01|
		var snd, env, ctrl;

		//ctrl = ;
		snd = Saw.ar([freq, freq+10], 1).tanh; // * LFNoise1.kr(trem_freq).range(depth, 1);
		snd = snd + Pulse.ar(freq*0.5, 0.6).dup;
		snd = snd + Pluck.ar(WhiteNoise.ar(1), 1, freq.reciprocal, freq.reciprocal, 10, 0);
		// SinOscFB.ar([freq, freq + 10], fb,1).tanh * LFNoise1.kr(trem_freq).range(depth, 1);
		// snd = snd + BrownNoise.ar(nois).tanh;
		// snd = snd * (Crackle.ar(LFNoise1.kr(3).range(1.0, 2.0)) * 0.3).tanh;
		snd = RLPF.ar(snd, freq + 100, 0.8);
		snd = FreeVerb.ar(snd, mix, room).tanh;
		// snd = DFM1.ar(snd, freq, res);
		env = EnvGen.ar(Env.perc(att,rel),doneAction:2);
		// env = EnvGen.ar(Env.linen(att,sustain, rel),doneAction:2);
		OffsetOut.ar(out, snd.dup * env * amp);
	}).add;

	SynthDef(\whale, { |out=0,amp=0.1,sustain=0.01,freq=200,fb=0, room=15, mix=0.8, res=0, nois=0.5, trem_freq=4, depth=0.9, rel=0.5, att=0.1, frange=50, del=0.05, comb=10, freq_n=3|
		var snd, env, ctrl;

		//ctrl = ;
		// snd = Formants.ar(LFNoise1.kr([freq_n, freq_n+1, freq_n-1, freq_n+2]).range(freq, freq+frange) * [1, 1.1, 1.2, 1.3], Vowel([\e, \o, \u], [\alto, \tenor])) * 3; // * LFNoise1.kr(trem_freq).range(depth, 1);

		snd = Splay.ar(SinOscFB.ar([freq, freq + 10, freq + 20, freq + 30], fb,1).tanh);
		snd = Splay.ar(PitchShift.ar(snd, 0.2, LFNoise1.kr(0.2).range(1, Array.fill(4, { rrand(0.5, 0.2)} )))).tanh;
		snd = DelayC.ar(RLPF.ar(snd, Rand(100, 3000), 0.03), 1, 1 / (2), 1, snd * 0.5);
		// snd = BrownNoise.ar(nois).tanh;
		// snd = snd * (Crackle.ar(LFNoise1.kr(0.7).range(1.0, 2.0)) * 0.3).tanh;
		// snd = snd * (PinkNoise.ar(LFNoise1.kr(0.3).range(1.0, 2.0)) * 0.3).tanh;
		// snd = CombC.ar(snd, 0.1, LFNoise1.kr(comb).range(0.03, 0.1));
		snd = FreeVerb.ar(snd, mix, room).tanh;
		// snd = DFM1.ar(snd, freq, res);
		env = EnvGen.ar(Env.linen(att,sustain, rel),doneAction:2);
		OffsetOut.ar(out, snd.dup * env * amp);
	}).add;

	SynthDef(\lake_eels, { |out=0,amp=0.1,sustain=0.01,freq=200,fb=0, room=3, mix=0.5, res=0, nois=0.2, trem_freq=4, depth=0.9, rel=0.5, att=0.1, frange=50, del=0.05, comb=0.3, freq_n=3|
		var snd, env, ctrl;

		//ctrl = ;
		snd = SinOsc.ar([440, 442] * SinOsc.ar(LFTri.kr(0.5).range(5, 50), 0, LFTri.kr(0.4).range(5, 50)), 0, 1); // * LFNoise1.kr(trem_freq).range(depth, 1);

		// SinOscFB.ar([freq, freq + 10], fb,1).tanh * LFNoise1.kr(trem_freq).range(depth, 1);
		snd = snd + BrownNoise.ar(nois).tanh;
		// snd = snd * (Crackle.ar(LFNoise1.kr(3).range(1.0, 2.0)) * 0.3).tanh;
		snd = CombC.ar(snd, 0.1, LFNoise1.kr(comb).range(0.03, 0.1));
		snd = RLPF.ar(snd, LFSaw.kr(0.3).range(2000, 500));
		snd = Mix.ar(FreeVerb.ar(snd, mix, room)).tanh;
		snd = Pan2.ar(snd, SinOsc.ar(LFTri.kr(0.1).range(1, 3)).range(-1, 1));
		// snd = DFM1.ar(snd, freq, res);
		env = EnvGen.ar(Env.linen(att,sustain, rel),doneAction:2);
		OffsetOut.ar(out, snd * env * amp);
	}).add;

	\Formants.asClass.notNil.if({
		"""
SynthDef(\witch, { |out=0,amp=0.1,sustain=0.01,freq=200,fb=0, room=3, mix=0.5, res=0, nois=0.2, trem_freq=4, depth=0.9, rel=0.5, att=0.1, frange=50, del=0.05, comb=10, freq_n=3, mult=1|
var snd, env, ctrl;

//ctrl = ;
snd = Formants.ar(LFNoise1.kr([freq_n, freq_n+1, freq_n-1, freq_n+2]).range(freq, freq+frange) * mult, Vowel([\e, \o, \u], [\alto, \soprano])) * 3; // * LFNoise1.kr(trem_freq).range(depth, 1);
snd = snd + SinOsc.ar([freq, freq*1.05] * SinOsc.ar(LFSaw.kr(0.5).range(50, 20), 0, LFSaw.kr(0.4).range(20, 50)), 0, 1);

// SinOscFB.ar([freq, freq + 10], fb,1).tanh * LFNoise1.kr(trem_freq).range(depth, 1);
// snd = snd + BrownNoise.ar(nois).tanh;
// snd = snd * (Crackle.ar(LFNoise1.kr(3).range(1.0, 2.0)) * 0.3).tanh;
// snd = CombC.ar(snd, 0.1, LFSaw.kr(comb).range(0.05, 0.01));
snd = FreeVerb.ar(snd, mix, room).tanh;
// snd = DFM1.ar(snd, freq, res);
env = EnvGen.ar(Env.linen(att,sustain, rel),doneAction:2);
OffsetOut.ar(out, snd.dup * env * amp);
}).add;
""".interpret;
	});


	SynthDef(\spider, { |out=0,amp=0.1,sustain=0.01,freq=200,fb=0, room=3, mix=0.5, res=0, nois=0.2, trem_freq=4, depth=0.9, rel=0.5, att=0.1, frange=50, del=0.05, comb=0.2, freq_n=3, width=1.0|
		var snd, env, ctrl;

		//ctrl = ;
		snd = Pulse.ar([freq, freq+10], LFTri.kr(1).range(0, width), 1).tanh; // * LFNoise1.kr(trem_freq).range(depth, 1);

		// SinOscFB.ar([freq, freq + 10], fb,1).tanh * LFNoise1.kr(trem_freq).range(depth, 1);
		// snd = snd + BrownNoise.ar(nois).tanh;
		// snd = snd * (Crackle.ar(LFNoise1.kr(3).range(1.0, 2.0)) * 0.3).tanh;
		snd = CombC.ar(snd, 0.1, LFNoise1.kr(comb).range(0.03, 0.1));
		snd = FreeVerb.ar(snd, mix, room).tanh;
		// snd = DFM1.ar(snd, freq, res);
		env = EnvGen.ar(Env.perc(att,sustain),doneAction:2);
		// env = EnvGen.ar(Env.linen(att,sustain, rel),doneAction:2);
		OffsetOut.ar(out, snd.dup * env * amp);
	}).add;


	\Formants.asClass.notNil.if({

		"""
SynthDef(\ghosts, { |out=0,amp=0.1,sustain=0.01,freq=200,fb=0, room=3, mix=0.5, res=0, nois=0.2, trem_freq=4, depth=0.9, rel=0.5, att=0.1, frange=50, del=0.05, comb=10, freq_n=3, cfreq=3|
var snd, env, ctrl;

//ctrl = ;
snd = Formants.ar(LFNoise1.kr([freq_n, freq_n+1, freq_n-1, freq_n+2]).range(freq, freq+frange) * [1, 1.1, 1.2, 1.3], Vowel([\e, \o, \u], [\alto, \tenor])) * 3; // * LFNoise1.kr(trem_freq).range(depth, 1);

// SinOscFB.ar([freq, freq + 10], fb,1).tanh * LFNoise1.kr(trem_freq).range(depth, 1);
snd = snd + BrownNoise.ar(nois).tanh;
snd = snd * (Crackle.ar(LFNoise1.kr(cfreq).range(1.0, 2.0)) * 0.3).tanh;
snd = CombC.ar(snd, 0.1, LFNoise1.kr(comb).range(0.03, 0.1));
snd = FreeVerb.ar(snd, mix, room).tanh;
// snd = DFM1.ar(snd, freq, res);
env = EnvGen.ar(Env.linen(att,sustain, rel),doneAction:2);
OffsetOut.ar(out, snd.dup * env * amp);
}).add;
""".interpret;
	});


	SynthDef(\dog, { |out=0,amp=0.1,sustain=0.01,freq=440,fb=0, room=3, mix=0.5, res=0, nois=0.5, trem_freq=4, depth=0.8, rel=0.5, att=0.1|
		var snd, env, ctrl;

		//ctrl = ;
		snd = SinOscFB.ar([freq, freq + 10], fb,1).tanh * LFNoise1.kr(trem_freq).range(depth, 1);
		// snd = snd + BrownNoise.ar(nois).tanh;
		// snd = snd * (Crackle.ar(LFNoise1.kr(3).range(1.0, 2.0)) * 4).tanh;
		snd = FreeVerb.ar(snd, mix, room).tanh;
		// snd = DFM1.ar(snd, freq, res);
		env = EnvGen.ar(Env.linen(att,sustain, rel),doneAction:2);
		OffsetOut.ar(out, snd.dup * env * amp);
	}).add;

	SynthDef(\bar1, {|out=0,amp=0.1,sustain=0.01,freq=440,fb=0, room=3, mix=0.5, res=0.99, nois=0.5, trem_freq=4, depth=0.8, rel=0.5, att=0.1|
		var snd, env, ctrl;

		//ctrl = ;
		snd = SinOscFB.ar([freq, freq], fb, 1).tanh;
		// snd = snd + BrownNoise.ar(nois).tanh;
		// snd = snd * (Crackle.ar(LFNoise1.kr(3).range(1.0, 2.0)) * 4).tanh;
		snd = FreeVerb.ar(snd, mix, room).tanh;
		// snd = DFM1.ar(snd, freq, res);
		env = EnvGen.ar(Env.perc(att,sustain),doneAction:2);
		OffsetOut.ar(out, snd.dup * env * amp);
	}).add;

	SynthDef(\mocktail, { |out=0,amp=0.1,sustain=0.01,freq=440,fb=0, room=3, mix=0.5, res=0.99, nois=0.5, trem_freq=4, depth=0.8, rel=0.5, att=0.1|
		var snd, env, ctrl;

		//ctrl = ;
		snd = SinOscFB.ar([freq], fb,1).tanh * LFNoise1.kr(trem_freq).range(depth, 1);
		// snd = snd + BrownNoise.ar(nois).tanh;
		snd = snd * (Crackle.ar(LFNoise1.kr(3).range(1.0, 2.0)) * 4).tanh;
		snd = snd + Dust.ar(10);
		// snd = Decay2.ar(snd, 0.01, 0.1, WhiteNoise.ar);
		snd = DelayN.ar(snd, 0.2, 0.2, 1, snd);
		// snd = DFM1.ar(snd, freq, res);
		snd = snd * (Crackle.ar(LFNoise1.kr(10).range(1.0, 2.0)) * 4).tanh;
		snd = FreeVerb.ar(snd, mix, room).tanh;
		// snd = DFM1.ar(snd, freq, res);
		env = EnvGen.ar(Env.linen(att,sustain, rel),doneAction:2);
		OffsetOut.ar(out, snd.dup * env * amp);
	}).add;

	SynthDef(\cage, {|out=0,amp=0.1,sustain=0.01,freq=440,fb=0, room=3, mix=0.5, res=0.99, nois=0.5, trem_freq=4, depth=0.8, rel=0.5, att=0.1|
		var snd, env, ctrl;

		//ctrl = ;
		snd = SinOscFB.ar([freq, freq], fb, 1).tanh;
		// snd = snd + BrownNoise.ar(nois).tanh;
		// snd = snd * (Crackle.ar(LFNoise1.kr(3).range(1.0, 2.0)) * 4).tanh;
		snd = FreeVerb.ar(snd, mix, room).tanh;
		// snd = DFM1.ar(snd, freq, res);
		env = EnvGen.ar(Env.perc(att,sustain),doneAction:2);
		OffsetOut.ar(out, snd.dup * env * amp);
	}).add;


	\Formants.asClass.notNil.if({
		"""
SynthDef(\barperson, { |out=0,amp=0.1,sustain=0.01,freq=200,fb=0, room=3, mix=0.5, res=0, nois=0.5, trem_freq=4, depth=0.9, rel=0.5, att=0.1, frange=50, del=0.08|
var snd, env, ctrl;

//ctrl = ;
snd = Formants.ar(LFNoise1.kr(5).range(freq, freq+frange), Vowel([\e, \o], [\alto, \tenor])) * 2 * LFNoise1.kr(trem_freq).range(depth, 1);

// SinOscFB.ar([freq, freq + 10], fb,1).tanh * LFNoise1.kr(trem_freq).range(depth, 1);
// snd = snd + BrownNoise.ar(nois).tanh;
snd = snd * (Crackle.ar(LFNoise1.kr(3).range(1.0, 2.0)) * 0.3).tanh;
snd = CombC.ar(snd, 0.1, del);
snd = FreeVerb.ar(snd, mix, room).tanh;
// snd = DFM1.ar(snd, freq, res);
env = EnvGen.ar(Env.linen(att,sustain, rel),doneAction:2);
OffsetOut.ar(out, snd.dup * env * amp);
}).add;
""".interpret;
	});


	s.sync;

	//w.getJSON({|json| json.debug("command line"); j = json; "JSON retrieved".postln});

	AppClock.sched(0, {
		w.getJSON({|json| json.debug("command line");

			AppClock.sched(0.5, {
				n = NetAPI.other(a, g, path:w);

				{
					4.wait;
					m = Moo.login(n, json, \parseText, rest:0.03);
					AppClock.sched(1, {
						m.gui.fontSize = 14;
						{
							var spider, ghosts, witch, lake, barperson, cage, mocktail, dog;

							spider = m[5929];
							ghosts = m[7668];
							witch = m[6360];
							lake = m[8829];
							barperson = m[6832];
							cage = m[5746];
							mocktail = m[4203];
							dog = m[3486];

							barperson.stop;
							barperson.pattern_(Pbind(\instrument, \barperson,
								\dur, barperson[\dur],
								\degree, Prand([1, 4, 2], 5) * (((Pfunc({barperson[\degree].value}) + 1)).round(1)),
								// \legato, 0.001,
								\scale, Scale.minor,
								\att, barperson[\att],
								\rel,  barperson[\rel],
								\room, 0.5,
								\octave, Prand([5, 4], inf),
							));

							cage.stop;
							cage.pattern_(Pbind(\instrument, \cage,
								\dur, Pfunc({cage[\dur].value}) * Pstutter(8, Pseq([1, 0.8, 0.6],inf), inf),
								\degree, (Pseq([0, 1, 2, 3, 4], 5) + Pstutter(5, Pseq([0, 3, 6, 9],inf), inf)) + (((Pfunc({ cage[\degree].value}) + 1)).round(1)),
								// \legato, 0.001,
								\scale, Scale.minor,
								\att, cage[\att],
								\rel, cage[\rel],
								\fb, cage[\fb],
								\room, cage[\room],
								\octave, Pstutter(4, Pseq([5, 6, 7], inf), inf),
							));

							mocktail.stop;
							mocktail.pattern_(Pbind(\instrument, \mocktail,
								\dur, mocktail[\dur],
								\degree, Pseq([1, 2, 7, 5, 2, 4], 25) * (((Pfunc({ mocktail[\degree].value}) + 1)).round(1)),
								// \legato, 0.001,
								\scale, Scale.minor,
								\att, mocktail[\att],
								\rel, mocktail[\rel],
								\fb, mocktail[\fb],
								\room, 0.5,
								\octave, Pstutter(4, Pseq([6, 5, 4], inf), inf),
							));

							dog.stop;
							dog.pattern_(Pbind(\instrument, \dog,
								\dur, dog[\dur],
								\degree, Pseq([1, 4, 2], 2) * (((Pfunc({dog[\degree].value}) + 1)).round(1)),
								// \legato, 0.001,
								\scale, Scale.minor,
								\att, dog[\att],
								\rel,  dog[\rel],
								\fb, dog[\fb],
								\room, 0.5,
								\octave, Pstutter(3, Pseq([5, 4], inf), inf),
							));


							spider.stop;
							spider.pattern_(Pbind(\instrument, \spider,
								\dur, spider[\dur],
								\degree, Pseq((0..8), 3) + Pstutter(5, Pseq([2, 4, 6, 8], inf), inf) + (((Pfunc({~spider[\degree].value}) + 1)).round(1)),
								// \legato, 0.001,
								\scale, Scale.minor,
								\freq_n, spider[\freq_n],
								\att, spider[\att],
								\rel,  spider[\rel],
								\fb, spider[\fb],
								\room, spider[\room],
								\octave, spider[\oct],
							));


							ghosts.stop;
							ghosts.pattern_(Pbind(\instrument, \ghosts,
								\dur, ghosts[\dur],
								\degree, Pseq([1], 1) * (((Pfunc({ghosts[\degree].value}) + 1)).round(1)),
								// \legato, 0.001,
								\scale, Scale.minor,
								\freq_n, ghosts[\freq_n],
								\att, ghosts[\att],
								\rel,  ghosts[\rel],
								\nois, ghosts[\nois],
								\fb, ghosts[\fb],
								\room, ghosts[\room],
								\cfreq, ghosts[\cfreq],
								\frange, ghosts[\frange],
								\comb, ghosts[\comb],
								\octave, ghosts[\oct], //Pseq([4], inf),
							));


							witch.stop;
							witch.pattern_(Pbind(\instrument, \witch,
								\dur, witch[\dur],
								\degree, (Pseq([5, 4, 3, 2, 1], 2) + Pstutter(5, Pseq([0, -1], inf), inf))* (((Pfunc({~witch[\degree].value}) + 1)).round(1)),
								// \legato, 0.001,
								\scale, Scale.minor,
								\freq_n, witch[\freq_n],
								\att, witch[\att],
								\rel,  witch[\rel],
								\sustain, 0.5,
								\fb, witch[\fb],
								\room, 0.5,
								\octave, Pseq([4], inf),
							));

							lake.stop;
							lake.pattern_(Pbind(\instrument, \lake_eels,
								\dur, lake[\dur],
								\degree, Pseq([1], 2) * (((Pfunc({lake[\degree].value}) + 1)).round(1)),
								// \legato, 0.001,
								\scale, Scale.minor,
								\freq_n, lake[\freq_n],
								\att, lake[\att],
								\rel,  lake[\rel],
								\fb, lake[\fb],
								\room, 0.5,
								\octave, Pseq([4], inf),
							));


						}.fork;
					}, nil);

				}.fork

			}, nil);

		});
	}, nil)

});


)


//n = NetAPI.other(a, g, path:w, joinAction:{"Join the Moo now".postln});
//m = Moo.login(n, j, \parseText);